
Graphical Method of Finding the Solution to Pair of Linear Equations in Two Variables
Graphical Method of Finding the Solution to Pair of Linear Equations in Two Variables: Overview
In this topic, we will learn the graphical method of finding the solution to a pair of linear equations in two variables. It illustrates the different cases of solutions to draw the lines. It also consists of some questions based on this concept.
Important Questions on Graphical Method of Finding the Solution to Pair of Linear Equations in Two Variables
Solve the pair of linear equations in two variables by graphical method.
The pair of linear equations and is:
Represent the following system of equations graphically and comment on solutions: .
Check whether the following pair of linear equation are dependent or independent.
.
Check whether the following pair of linear equation are dependent or independent.
.
Find the value of so that the following system of equations has infinitely many solutions.
What should not be the value of so that the given system of equations has no solution.
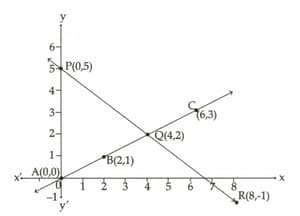
The given graph represents a pair of linear equations in two variables. Write how many solution these pair of equations have.
Find the value of for which the given equations have infinitely many solutions: .
Solve the linear pair of equations graphically and find the co-ordinates of that points where lines
represent them, cut at -axis ;
Solve the following linear pairs by graphical method and find co-ordinates of vertices of triangle, formed by -axis and lines formed by linear pairs.
;
Solve the linear pairs , by graphical method and find co-ordinates of point where lines representing by them cuts -axis.
Solve the following linear pairs by graphical method and find co-ordinates of point where lines representing by them cuts -axis
;
Shown below are three graphs.
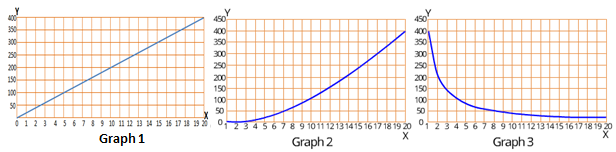
Which of the above is/are graph(s) of a linear equation?
The current in a circuit, in Amperes, I = is given by $ \frac{\text{V}}{\text{R}}$ , where ‘V’ is the voltage (in volts) and R (ohms) is the resistance.
The graph gives the strength of current passing through the circuit. The resistance of the circuit is varied from 1Ω to 7Ω and reading in the volt meter changes accordingly.
(Note: 1A = 1000 mA)
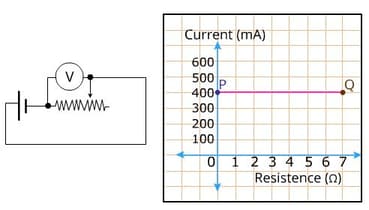
The voltmeter would read _____ volts, when resistance is 5Ω.
A consumer pays his electricity bill as per the scheme below.
(1) For the first 30 units (i.e. 0 to 30 units) &rupee;100.
(2) &rupee;5 for every unit beyond 30.
Solve the linear pair of equations graphically and with the help of this find value of where as ;
Solve graphically and write the nature of solution.
Solve graphically and write the nature of the solution.
Solve graphically and write the nature of their solution.


